

Rand briefly breaks R16 to the US dollar
The South African Rand has briefly broken through the psychologically important R16-to-the-US-dollar barrier, reaching its strongest levels in months as a weaker greenback and rising gold prices provided support for the local currency.
The move represents a significant recovery for the Rand, which has strengthened by almost 9% against the US Dollar over the past 12 months.
Recent trading has seen the Rand approach – and briefly move through – the R16 level as global developments have put renewed pressure on the US dollar. Reuters reported on 21 August that the rand had strengthened to its best level since the start of the conflict involving the US, Israel and Iran, supported by a weaker dollar and higher gold prices.
But while the move below R16 is undoubtedly a significant psychological milestone, a broader comparison against other major currencies suggests that the story is more complicated than a simple case of rand strength.
A strong Rand — or a weak Dollar?
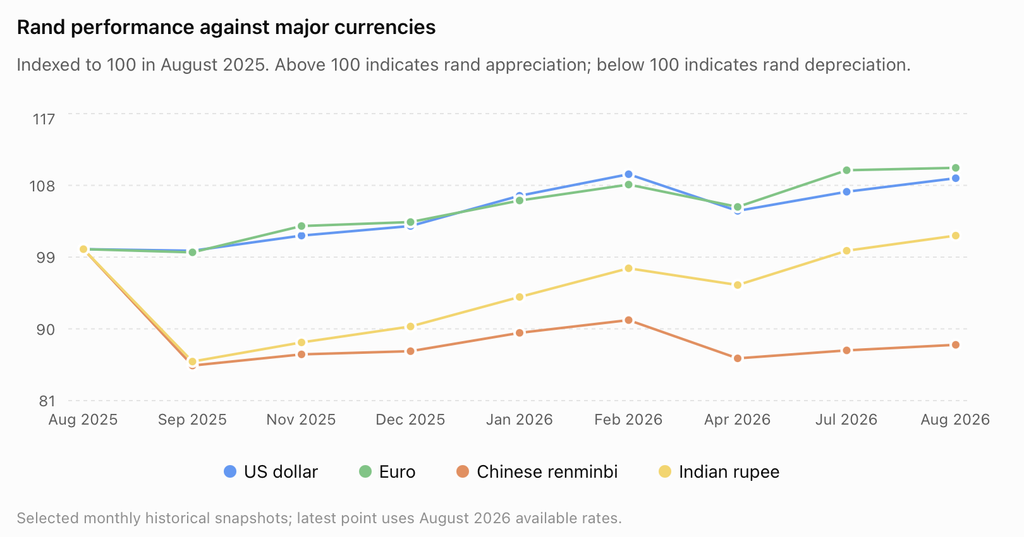
Over the past year, the rand has strengthened by approximately 8.9% against the US dollar.
However, the dollar itself has been under pressure. In recent weeks, concerns around US monetary policy, Treasury market developments and broader geopolitical uncertainty have contributed to periods of dollar weakness.
This means that measuring the rand solely against the greenback can sometimes give an incomplete picture.
The SA Trade Desk comparison of the rand against the US Dollar, Euro, Chinese Renminbi and Indian Rupee shows that the local currency’s performance has varied significantly depending on which currency is being used as the benchmark.
The Rand has also gained against the Euro
Perhaps surprisingly, the Rand’s performance has not been confined to the US dollar.
Over the same broad 12-month period, the Rand has strengthened by approximately 10% against the Euro.
That suggests that at least part of the recent rally reflects genuine Rnd strength rather than simply weakness in the US dollar.
The Rand’s performance has been supported by a combination of factors, including periods of improved global risk appetite, higher precious-metal prices and shifting expectations around US monetary policy. As a major gold-producing country, South Africa’s currency often benefits when gold prices rise.
A very different picture against China
The story changes dramatically when the rand is measured against the Chinese Renminbi.
Over the past year, the rand has weakened by roughly 12% against China’s currency.
This is an important distinction for South Africa, given the scale of trade between the two countries.
While a stronger Rand against the US dollar may reduce the cost of dollar-denominated imports and provide some relief to consumers and businesses importing goods priced in dollars, the weakening against the renminbi means that the purchasing power of the rand has deteriorated against the currency of one of South Africa’s most important trading partners.
The contrast highlights the danger of judging the rand’s performance exclusively through the USD/ZAR exchange rate.
Holding its own against India
Against the Indian Rupee, meanwhile, the Rand has remained broadly stable over the period and is modestly stronger than it was a year ago.
The Indian rupee has faced its own pressures, including higher oil prices and periods of strong demand for dollars, with the Reserve Bank of India closely managing conditions in the currency market.
The result is that the Rand has gained only marginally against the rupee, in sharp contrast to its performance against the Dollar and euro.
What the R16 milestone really tells us
The Rand breaking below R16 to the US dollar is undoubtedly a significant moment.
It marks a substantial recovery from the much weaker levels seen during 2025 and provides a useful illustration of how quickly currency markets can move when global conditions change.
However, the broader currency comparison tells a more nuanced story.
The rand has performed strongly against both the US dollar and the euro, has remained relatively stable against the Indian rupee, but has weakened significantly against the Chinese renminbi.
In other words, the Rand is not simply “strong” or “weak”. Its performance depends heavily on which currency is being used as the yardstick.
For South African importers, exporters and businesses involved in international trade, that distinction matters.
A stronger rand against the US dollar may make some imports cheaper and improve the economics of dollar-denominated transactions. But a weaker rand against the renminbi could increase costs for businesses importing goods and components from China.
The move below R16 therefore makes for a powerful headline – but the full story of the rand’s past year is considerably more complex.
The Dollar may have provided the headline, but the broader currency picture shows where the rand has really gained ground – and where it has not.
Is your business geared for currency volatility?
As a South African importer or exporter, currency volatility and the movement of the Rand is a key driver of profitability.
To support our stakeholders, the SA Trade Desk has entered into a strategic partnership with Verto – a unified B2B platform that enables businesses to manage cross-border payments and foreign exchange with ease and security. Their solutions are designed to make international transactions faster, more transparent, and more cost-effective. By leveraging Verto, businesses can:
- Streamline payments across multiple countries and currencies
- Reduce operational complexity with an integrated platform for FX and cross-border transactions
- Enhance financial security and compliance with industry-standard controls
- Gain visibility and control over international cash flow
- Access strategic insights to optimise global operations
You can find out more information on this partnership here.
The exchange-rate comparison is based on historical mid-market rates indexed to 100 at the starting point in August 2025. Figures are intended to illustrate relative currency performance and will vary slightly depending on the exact time and data source used.